2012 年美国销售的房屋增加!!!
U.S. sales of houses increase
WASHINGTON - Americans bought more previously owned homes in April, a hopeful sign that the weak housing market is gradually improving.
The National Association of Realtors said Tuesday that home sales rose 3.4 percent last month to a seasonally adjusted annual rate of 4.62 million. Home sales have rebounded after falling in March and are near the pace from January and February, which was the best winter in five years. Still, annual sales are well below the nearly 6 million equated with healthy markets.
A mild winter encouraged some people to buy homes earlier this year. That drove up sales in January and February, making March weaker. First-time buyers, who are critical to a housing recovery, rose in April to 35 percent of sales. That's up from 32 percent in March.
"First-time homebuyers are slowly making their way back," said Jennifer Lee of BMO Capital Markets. "That is still below the 40 percent to 45 percent range during healthy times, but the highest in almost half a year."
Homes at risk of foreclosure accounted for 28 percent of sales. That's roughly in line with March sales but down from 37 percent of sales in April 2011. The median sales price in April rose to $177,400, up 10.1 percent from a year ago.
Sales rose in all regions, though some markets within those regions such as Las Vegas saw a drop in sales. The Greater Las Vegas Association of Realtors reported 3,185 single-family home sales in April, down nearly 10 percent from 3,534 sales in March. They're up 3.3 percent from 3,084 sales in April 2011.
The median price in Las Vegas rose 4 percent to $127,900 in April, the third consecutive monthly increase. It's up 2.3 percent from a year ago.
Modest increases in home sales are the latest sign that the market could be starting to turn nearly five years after the housing bubble burst.
Looking at construction starts, existing home sales and foreclosure rates, housing is 37 percent of the way back from its low point, up from 20 percent in April 2011, said Jed Kolko, chief economist of Trulia.com online listing service.
In addition, some of the nation's largest banks have begun to undertake more short sales rather than merely foreclosing on struggling homeowners, an approach that experts say will cut down on vacant homes and help to heal the market.
Asking prices have risen nationally for three straight months, and are up quarter-over-quarter in 92 of the 100 largest metros, he noted.
"Aside from a slight stumble in March, the housing recovery is progressing slowly but steadily," Kolko said.
The sales pace in January was the highest since May 2010 - when a popular home-buying tax credit expired. Builders are more confident and are starting to build more homes. Mortgage rates have never been cheaper. And the job market is improving, which has made more people open to buying.
Still, many would-be buyers are having difficulty qualifying for home loans or can't afford larger down payments now required by banks. Some also fear prices could keep falling.
Builders have gained confidence since last fall, in part because more people have expressed interest in buying. In May, builder optimism rose to the highest level in five years, according to the National Association of Home Builders/Wells Fargo builder sentiment index.
Last week, the Commerce Department reported that builders started work on more homes and apartments in April, pushing housing construction to a seasonally adjusted annual rate of 717,000 homes. That was near a rate of 720,000 homes and apartments being built in January, which had been a three-year high. But even with the recent strength, housing starts remain at roughly half the pace considered healthy.
Many economists believe that 2012 could be the year that housing finally makes a positive contribution to overall economic growth. That hasn't happened since 2005, before the housing bust.
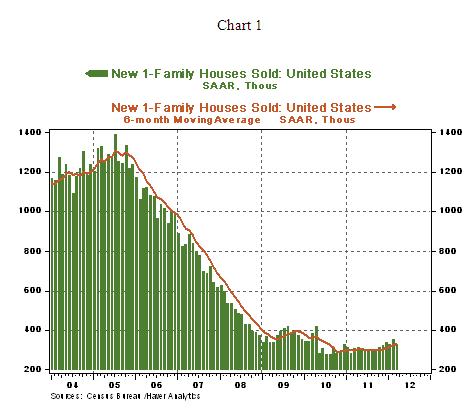
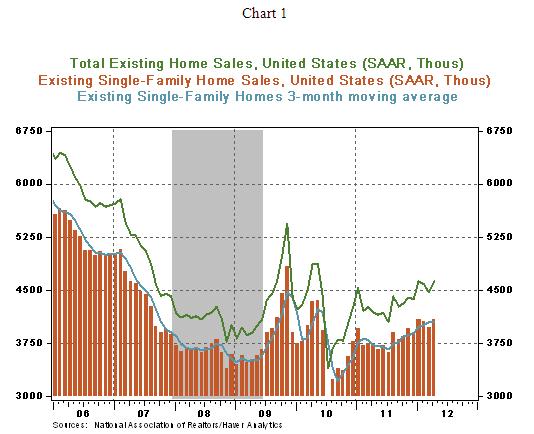
While we are looking at new home sales, it is instructive to peruse data of existing home sales also. Sales of existing homes fell in February (-0.7%%) and March (-2.6%) but increased in January (+5.7%) and raised the quarterly average. The 6-month moving average of existing home sales in March is 4.468 million units, up nearly 15% from a low of 3.888 million units seen in April 2009 (the low of 2010 is excluded because the wide swings were related to the first-time homebuyer credit program (see Chart 2). The main conclusion is that much like the market of new homes, sales of existing homes show a small but noticeable upward trend.
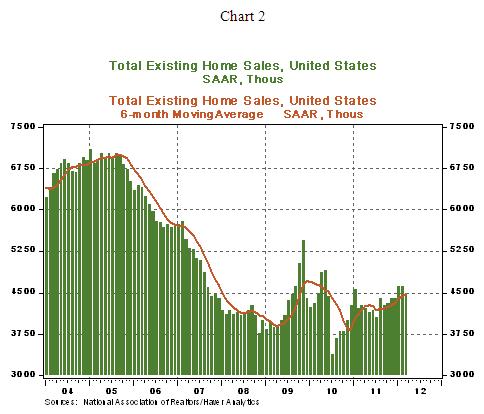
Hopping back to the market for new homes, in March, sales of new homes dropped in the Midwest (-20%) and West (27%) but rose in the Northeast (+7.7%) and South (+3.1%). Inventories of unsold new homes rose to 5.3-month supply during March from a downwardly revised 5.0-month mark in the prior month. The historical median for the inventory-sales ratio is 6.0-months, which implies that the current inventory of unsold new homes is not problematic. The median price of a new single-family home slipped slightly to $234,500 in March from $236,900 during February.
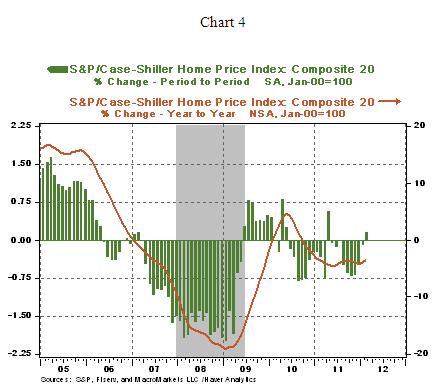
Speaking about home prices, the Case-Shiller Home Price Index for February moved up 0.2%, a rare monthly gain. As shown in Chart 4, the stretch from early 2006 – February 2012 is marked with few monthly gains, with most related to the first-time home buyer program that was in place during most of 2009-2010. But, the Case-Shiller Home Price Index fell 3.5% from a year ago and dampens the enthusiasm related to the monthly increase. The question now is if the February increase is the beginning of a long line of monthly gains in prices of homes. In February, thirteen out of the 20 metro areas posted an increase in the home price index on a monthly basis, but only two metro areas (New York and Miami) show gains from a year ago. It is entirely possible that the February data are a precursor of more positive tidings from the housing market given the recent developments in the labor market. But, it is premature to declare all is clear because home prices are yet to stabilize, let alone posting sustained gains, and home foreclosures and negative equity remain a significant source of concern.
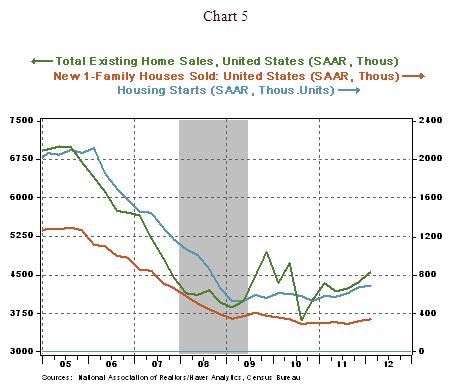
In sum, Chart 5 (quarterly count of home sales and starts) shows that sales of homes are moving up gradually and a mild upward trend of housing starts is also evident. Inventories of unsold homes are not worrisome as they were several months ago and home prices are not in a free falling mode. This brief description of housing market developments should have been better after 11 quarters of economic growth. But, current circumstances are atypical and the turnaround in home sales visible now is noteworthy. Data revisions are possible which could change the current assessment, particularly that of new home sales which are reputed for large revisions.
Asha Bangalore — Senior Vice President and Economist
.png)

