Lake Mead Water Levels — Historical and Current
http://www.arachnoid.com/NaturalResources/

Figure 1 shows a picture from my archives of the area around Pearce Ferry, showing the dry land between the end of the road and the Colordo River.
Lake Mead Water Levels — Historical and Current
Horizontal Axis: Years
Vertical Axis: Feet above Mean Sea Level
Vertical Axis: Feet above Mean Sea Level
(Chart scale and labels updated January 2014)
This chart is dynamically updated. This page reads data from a government archive of water heights for Lake Mead from 1935 to the present, and draws the chart on that basis. The database, located at http://www.usbr.gov/lc/region/g4000/hourly/mead-elv.html, is updated once per month. This page's graphic updates itself in step with the data source, over time giving an easy-to-interpret picture of Lake Mead water levels.
The chart on this page will show the Lake Mead water level until the source data page disappears or is moved, after which I will have to revise the code responsible for drawing the graphic.
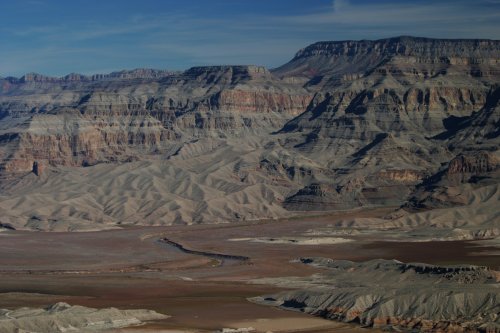
Figure 1: View of Lake Mead and the Colorado River
from Pearce Ferry, January 2004
And why am I interested in monitoring this particular lake? In years past I have been able to paddle my kayak from Pearce Ferry, on the east end of Lake Meade, into the very pretty western Grand Canyon, but in the past few years (writing in 2005), the east end of the lake has dried up, making an enjoyable outing impossible until the water rises again — assuming it ever does.
Figure 1: View of Lake Mead and the Colorado River
from Pearce Ferry, January 2004
The observant reader will notice a pattern of rapidly varying water height in the Lake Mead chart above from 1935 until the mid-1960s, after which the water level became more consistent in the short term. My theory is this smoothing was caused by the fact that Lake Powell, upstream from Lake Mead, began to fill in 1966, taking 17 years to fill completely (that would take us to 1983). It is reasonable to assume the people overseeing this filling operation took more water for Lake Powell at times of rapid flow, thus smoothing out the flow peaks and troughs that were seen in Lake Mead beforehand. Since that time I would guess that Lake Powell now absorbs the annual peaks and troughs once seen in the Lake Mead data, and acts as a buffer for Lake Mead. I would love to confirm this theory, but there seems not to be a convenient monthly water level database for Lake Powell, as there is for Lake Mead.
Update (2010) New York Times: Water Use in Southwest Heads for a Day of Reckoning — Describes steps that will have to be taken if Lake Mead's water level drops below 1075 feet. Briefly, this critical shortage level will automatically trigger emergency measures agreed on by the seven nearby states that depend on Lake Mead's water — including rationing. Ironically, the proposed rationing measures don't include California, whose water demands get first priority.
Update (2014) New York Times: Colorado River Drought Forces a Painful Reckoning for States — More detail, more concern, as Colorado river flow declines further. "The sinuous Colorado River and its slew of man-made reservoirs from the Rockies to southern Arizona are being sapped by 14 years of drought nearly unrivaled in 1,250 years." "...many experts believe the current drought is only the harbinger of a new, drier era in which the Colorado’s flow will be substantially and permanently diminished." The meaning of the above chart's ration regime and pump limit labels is provided in the linked article.
.png)

