bearbear 美股熊市还远未开启
http://finance.sina.com.cn/world/20140515/054919112066.shtml
美股熊市还远未开启
2014年05月15日 05:49 FX168 我有话说(20人参与) 收藏本文
https://www.google.com/search?q=%E6%94%B6%E7%9B%8A%E7%8E%87%E6%9B%B2%E7%BA%BF%E5%8F%AF%E4%BB%A5%E9%A2%84%E6%B5%8B%E7%86%8A%E5%B8%82&rlz=1C1RNLH_enUS562US562&oq=%E6%94%B6%E7%9B%8A%E7%8E%87%E6%9B%B2%E7%BA%BF%E5%8F%AF%E4%BB%A5%E9%A2%84%E6%B5%8B%E7%86%8A%E5%B8%82&aqs=chrome..69i57.265j0j1&sourceid=chrome&ie=UTF-8
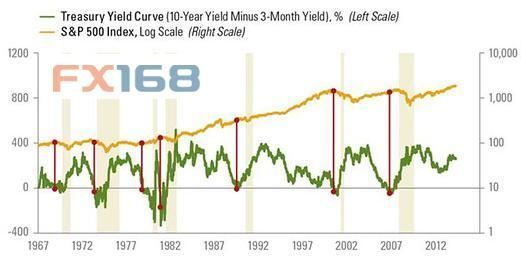
LPL Financial首席经济学家Jeffrey Kleintop表示,那些想要找合适机会做空股市的投资者如果将视线放到其他方面,他们可能会做得更好,比如国债收益率曲线。他表示,收益率曲线在过去50年中成功预测了股市见顶的行情,但是目前并未显示出股市见顶的迹象。
 (绿线表示10年期国债收益率减去3个月收益率之差,黄线代表标普500指数,来源:MarketWatch)
收益率曲线是另一个表达短期和长期国债收益率之间关系的方式。它是受到经济学家青睐的方式,因为收益率曲线可以说明经济的运行状况。
收益率曲线变陡表示不同年限的国债收益率差在扩大,也暗示着经济向好。相反,如果收益率曲线渐趋平坦,经济增长前景则更不明朗。
Kleintop称,如果美联储(Fed)大幅升高主要再融资利率,短期国债收益率将会大幅上扬。如果短期国债收益率上扬至长期收益率曲线上方,我们称之为收益率曲线的反向。反向收益率曲线暗示经济衰退即将到来,这也意味着股市牛市的终结。
投资者可以使用多个收益率曲线的组合来计算收益率差,但是Kleintop选择使用3个月期国债和10年期国债。以下是过去50年中收益率差低于零的时候。
Kleintop写道,在过去50年中每次经济衰退都可以被美联储升息的预期所预测,收益率曲线的反转一般发生在金融危机来临前的12个月,但是该时间的变化范围是5至16个月。
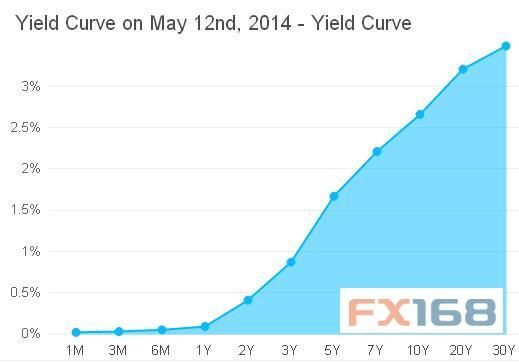
以下是本年度美国国债收益率曲线:
 (美国国债收益率曲线,来源:Marketwatch)
Kleintop还写道,即使长期利率低于2.6%,发转收益率差0.5%需要美联储将利息从0%附近升至3%,根据最新调查显示美联储在2017年才会将利息升至3%。实施显示,投资者还远远不用担心美国股市将会出现熊市
@@@@@@@@@@@@@@@@@@@
。
2014年05月15日 05:49 FX168 我有话说(20人参与) 收藏本文
LPL Financial首席经济学家Jeffrey Kleintop表示,那些想要找合适机会做空股市的投资者如果将视线放到其他方面,他们可能会做得更好,比如国债收益率曲线。他表示,收益率曲线在过去50年中成功预测了股市见顶的行情,但是目前并未显示出股市见顶的迹象。
 (绿线表示10年期国债收益率减去3个月收益率之差,黄线代表标普500指数,来源:MarketWatch)
收益率曲线是另一个表达短期和长期国债收益率之间关系的方式。它是受到经济学家青睐的方式,因为收益率曲线可以说明经济的运行状况。
收益率曲线变陡表示不同年限的国债收益率差在扩大,也暗示着经济向好。相反,如果收益率曲线渐趋平坦,经济增长前景则更不明朗。
Kleintop称,如果美联储(Fed)大幅升高主要再融资利率,短期国债收益率将会大幅上扬。如果短期国债收益率上扬至长期收益率曲线上方,我们称之为收益率曲线的反向。反向收益率曲线暗示经济衰退即将到来,这也意味着股市牛市的终结。
投资者可以使用多个收益率曲线的组合来计算收益率差,但是Kleintop选择使用3个月期国债和10年期国债。以下是过去50年中收益率差低于零的时候。
Kleintop写道,在过去50年中每次经济衰退都可以被美联储升息的预期所预测,收益率曲线的反转一般发生在金融危机来临前的12个月,但是该时间的变化范围是5至16个月。
以下是本年度美国国债收益率曲线:
 (美国国债收益率曲线,来源:Marketwatch)
Kleintop还写道,即使长期利率低于2.6%,发转收益率差0.5%需要美联储将利息从0%附近升至3%,根据最新调查显示美联储在2017年才会将利息升至3%。实施显示,投资者还远远不用担心美国股市将会出现熊市
@@@@@@@@@@@@@@@@@@@
。
Bear market won’t come until the yield curve says so: Kleintop
May 13, 2014, 1:23 PM ET
Jittery investors who are looking to the indexes for signs of an approaching bear market might do better by focusing their attention elsewhere: on the yield curve. So says Jeffrey Kleintop, chief market strategist at LPL Financial, who asserts in a note Tuesday that the yield curve has a perfect track record of predicting the top of the stock market over the past 50 years, and it’s not signaling a bear market right now.
The yield curve is another way of describing the difference between short-term Treasury yields and long-term yields. It’s a favorite tool among financial and economics wonks because of what it says about the economy. The widening between the yields of different maturities, known as a steepening curve, often signals a brightening economic outlook. On the contrary, if the curve flattens considerably, the growth outlook tends to be souring.
If the Federal Reserve aggressively hikes its key policy rate, short-term Treasury yields in turn rise swiftly. If short-term yields climb higher than long-term rates, the curve is said to invert. An inverted yield curve is generally a sign that a recession is about to begin, which means that it’s also a predictor of the top of a bull market in equities, says Kleintop.
There are a number of different Treasury maturities one can use to calculate the yield curve, but Kleintop chooses to find the spread between the 3-month T-bill /quotes/zigman/4868356/delayed 3_MONTH +40.00% and the 10-year note /quotes/zigman/4868283/delayed 10_YEAR -0.71% . Here’s where that differential has turned negative over the past 50 years, and how it compares with the S&P 500 index /quotes/zigman/3870025/realtime SPX -0.46% :
Writes Kleintop:
So now you’re worried about when the curve will invert. The yield curve has certainly been flattening over the last half year as bond investors fret about when the Fed will begin hiking its lending rate, which has been pegged near zero for the past half decade. But the good news is that the curve is still steep — and certainly a long ways from inverting. Here’s what the curve looked like on Monday:
As Kleintop writes:

- Shutterstock
If the Federal Reserve aggressively hikes its key policy rate, short-term Treasury yields in turn rise swiftly. If short-term yields climb higher than long-term rates, the curve is said to invert. An inverted yield curve is generally a sign that a recession is about to begin, which means that it’s also a predictor of the top of a bull market in equities, says Kleintop.
There are a number of different Treasury maturities one can use to calculate the yield curve, but Kleintop chooses to find the spread between the 3-month T-bill /quotes/zigman/4868356/delayed 3_MONTH +40.00% and the 10-year note /quotes/zigman/4868283/delayed 10_YEAR -0.71% . Here’s where that differential has turned negative over the past 50 years, and how it compares with the S&P 500 index /quotes/zigman/3870025/realtime SPX -0.46% :
“Every recession over the past 50 years was preceded by the Fed hiking rates enough to invert the yield curve. That is seven out of seven times — a perfect forecasting track record. The yield curve inversion usually takes place about 12 months before the start of the recession, but the lead time ranges from about five to 16 months. The peak in the stock market comes around the time of the yield curve inversion, ahead of the recession and accompanying downturn in corporate profits.This puts Kleintop in the same camp as Jonathan Golub, chief U.S. market strategist at RBC Capital Markets, who also claims the the bull market has more room to run because a recession isn’t imminent.
So now you’re worried about when the curve will invert. The yield curve has certainly been flattening over the last half year as bond investors fret about when the Fed will begin hiking its lending rate, which has been pegged near zero for the past half decade. But the good news is that the curve is still steep — and certainly a long ways from inverting. Here’s what the curve looked like on Monday:
As Kleintop writes:
“Even if long-term rates stay at the very low yield of 2.6%, to invert the yield curve by 0.5% the Fed would need to hike rates from around zero to over 3%! Based on the latest survey of current Fed members that vote on rate hikes, conducted earlier this year, members do not expect to raise rates above 3% until sometime in 2017, at the earliest. The facts suggest the best indicator for the start of a bear market may still be a long way from signaling a cause for concern.”


.png)
